
Fiat Elpis · Market structure and seasonality note 27
Tax-loss selling can reach Nasdaq winners
Micron gained 173% year to date while recent buyers accumulated losses. Twenty years of Nasdaq-100 returns show what that does, and does not, predict for December and January.
Fiat Elpis research note
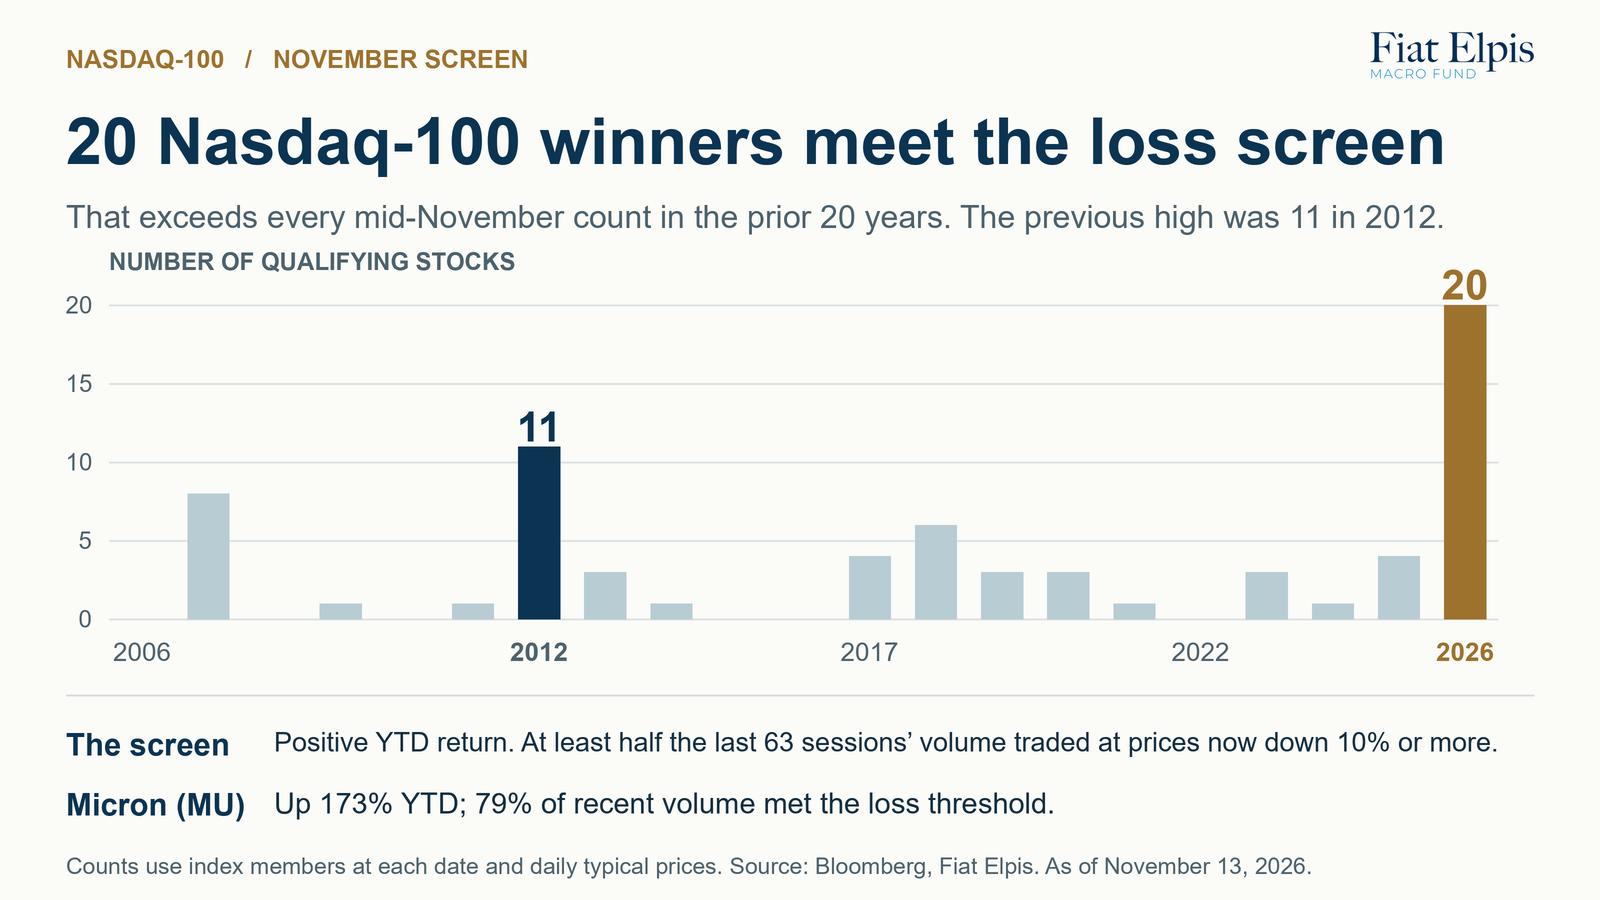
Twenty Nasdaq-100 stocks finished November 13 above their 2025 year-end close even though at least half their recent trading volume took place at prices now 10% or more underwater. The highest count in our previous 20 mid-November screens was 11, in 2012.
01 · Purchase price
How a winner becomes a tax-loss candidate
A stock opens the year at $50, climbs to $100 and falls to $85. It is still up 70% for the year. A taxable investor who bought at $100 can nevertheless realize a $15 loss per share by selling. Someone who bought at $50 would realize a $35 gain on the same trade. That difference in purchase price is why a list of year-to-date losers misses potential tax sellers.
Micron illustrates the distinction. It was up 173% year to date on November 13, yet 79% of the preceding 63 trading sessions’ share volume changed hands at estimated prices that put those purchases at a loss of 10% or more by the close. The same shares can trade many times, so 79% is a share of trading volume, not a count of shareholders.
02 · The historical test
Did the candidates lag first and rebound in January?
Each November from 2006 through 2025, we rebuilt the Nasdaq-100 as it existed at the time. We estimated how many shares still held carried an unrealized loss of 10% or more, then ranked that inventory relative to normal daily trading volume. A large inventory in a thinly traded stock can matter more to its price than the same number of shares in a liquid stock.
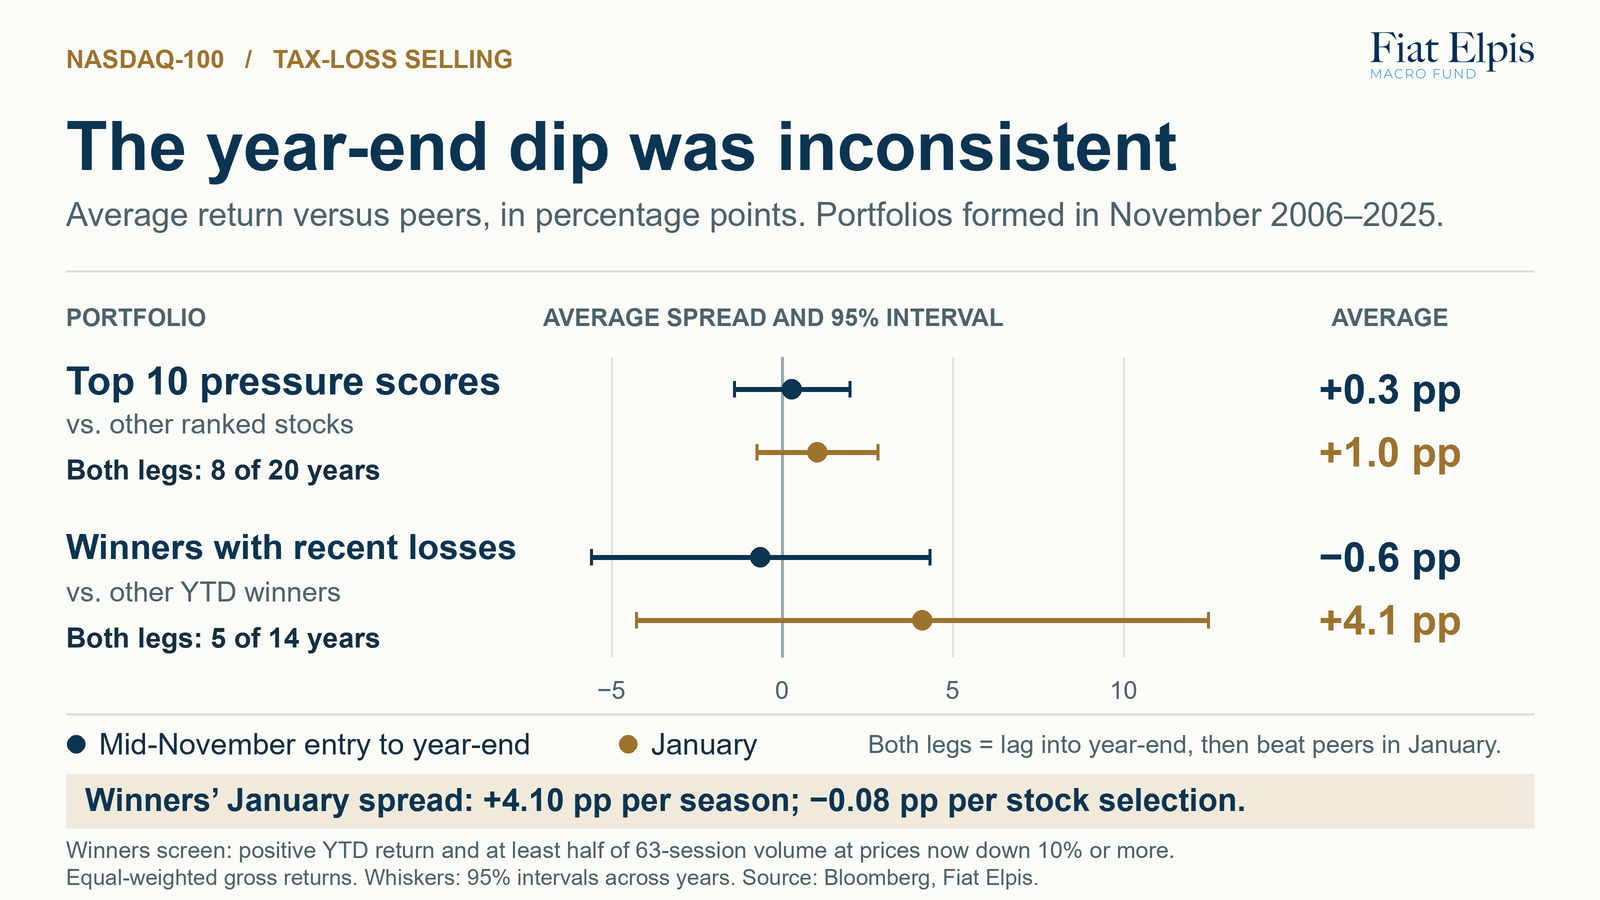
From the next session’s close to the final December close, the ten highest-ranked securities beat the other ranked members by an average of 0.28 percentage points. In January they beat those peers by 1.02 points. The anticipated sequence of year-end underperformance followed by January outperformance occurred in 8 of 20 seasons.
Among year-to-date winners with recent buyers underwater, that sequence occurred in 5 of the 14 seasons with qualifying stocks. Their average January edge over other winners was 4.10 points with each season weighted equally. Weight each of the 50 selections equally and the spread becomes −0.08 points. A season with a single qualifying name has much more influence under the first calculation. All four seasonal mean spreads shown below have 95% intervals that include zero.
03 · Who trades first?
Hedge funds could move the selling forward
A hedge fund can anticipate a predictable tax seller using public price and volume data. If several funds short the same stock before that seller arrives, their trades can push the price down, putting more recent purchases underwater. When taxable investors sell, the funds can buy those shares to cover. The expected selling then meets a buyer, and the rebound can begin before January. If fewer tax sellers appear than the shorts expected, covering can pull the rebound forward again.
There is precedent for this mechanism in a different setting. Chen, Hanson, Hong and Stein found that short interest rose ahead of sales by distressed mutual funds. Our Nasdaq study observes prices, volume and returns. It cannot identify taxable accounts, hedge funds or a trader’s reason for selling.
04 · What to monitor
Look for the order of the flows
Netflix ranks first, with estimated underwater inventory equivalent to 67.6 days of average volume. Nvidia is second at 57.0 days, Baker Hughes third at 50.1 and Cisco fourth at 49.8. Micron ranks 30th at 24.0 days despite the losses in its recent trading. These figures measure estimated shares held at a loss. How many holders will actually sell remains unknown. To test the hedge-fund explanation, watch whether stock on loan or reported short interest rises before retail selling, then falls as shares are bought back into weakness. Lending demand has other uses, and short-interest reports arrive with a lag.
Sources & method
How we estimated the exposure
Fiat Elpis calculations using Bloomberg daily prices, share volume, float, historical index membership and gross total returns. Each screen used the last close on or before November 15. The recent-volume screen estimates each day’s purchase price from its high, low and close. The separate inventory model uses up to two years of trading and estimates how many shares from each purchase date still remain, using float turnover. Older holdings have unknown basis. Rankings measure estimated underwater shares divided by 20-session average share volume. The historical test gives each selected security equal weight within its season, then compares the selected group with other ranked members or, for the winners screen, other year-to-date winners. Returns include documented merger consideration and exclude trading costs.
- Ivković, Poterba and Weisbenner, “Tax-Motivated Trading by Individual Investors” — taxable versus tax-deferred brokerage accounts.
- Chen, Hanson, Hong and Stein, “Do Hedge Funds Profit From Mutual-Fund Distress?” — short interest ahead of distressed fund sales.