
Fiat Elpis · Bonds and market structure note 19
POST MORTEM of the bond market
The post-Fed bounce gave way to a punishing duration reversal. Auction participation is weaker. The next question is how much selling the market can absorb before leverage makes the adjustment disorderly.
Fiat Elpis macro research · September 30 market snapshot
The casualty is confidence in an easy turn in the bond market. Investors who bought the post-Fed bounce have been handed a sharp loss, while the latest auction snapshot shows buyers demanding higher yields. My concern is the interaction between duration, supply and financing: a bad trade can become a market problem when several holders need to exit together.
01 · The TLT reversal
The bounce became the trap
In the supplied Bloomberg terminal snapshot, TLT closed at $80.88 on September 16, rose to $81.78 on September 17, then fell to $78.14 at the September 30 observation. That is a 3.39% price decline from Fed day and a 4.45% decline from the following day's close. The September 30 figure is the supplied observation, not an independently established closing price.
For someone who covered a short and bought that bounce, the reversal is particularly painful. The last-hike narrative may have offered a reason to add duration, but it did not establish a durable floor under bond prices. TLT captures the long end; these returns do not describe every Treasury maturity or every bond portfolio.
| Metric | Value |
|---|---|
| TLT daily 1-sigma (2yr history, 501 days) | 0.736% |
| Annualised volatility | 11.7% |
| Fed day close (Sep 16) | $80.88 |
| Sep 17 close (after the reported short squeeze) | $81.78 |
| Sep 30 supplied price snapshot | $78.14 |
| Fed day to Sep 30: price return | -3.39% |
| Sep 17 close to Sep 30: price return | -4.45% |
| Fed day decline / DAILY sigma | 4.6x |
| Sep 17 decline / DAILY sigma | 6.0x |
| Sessions since Sep 16 / since Sep 17 | 10 / 9 |
| Horizon-adjusted move: 10 / 9 sessions | 1.5σ / 2.0σ |
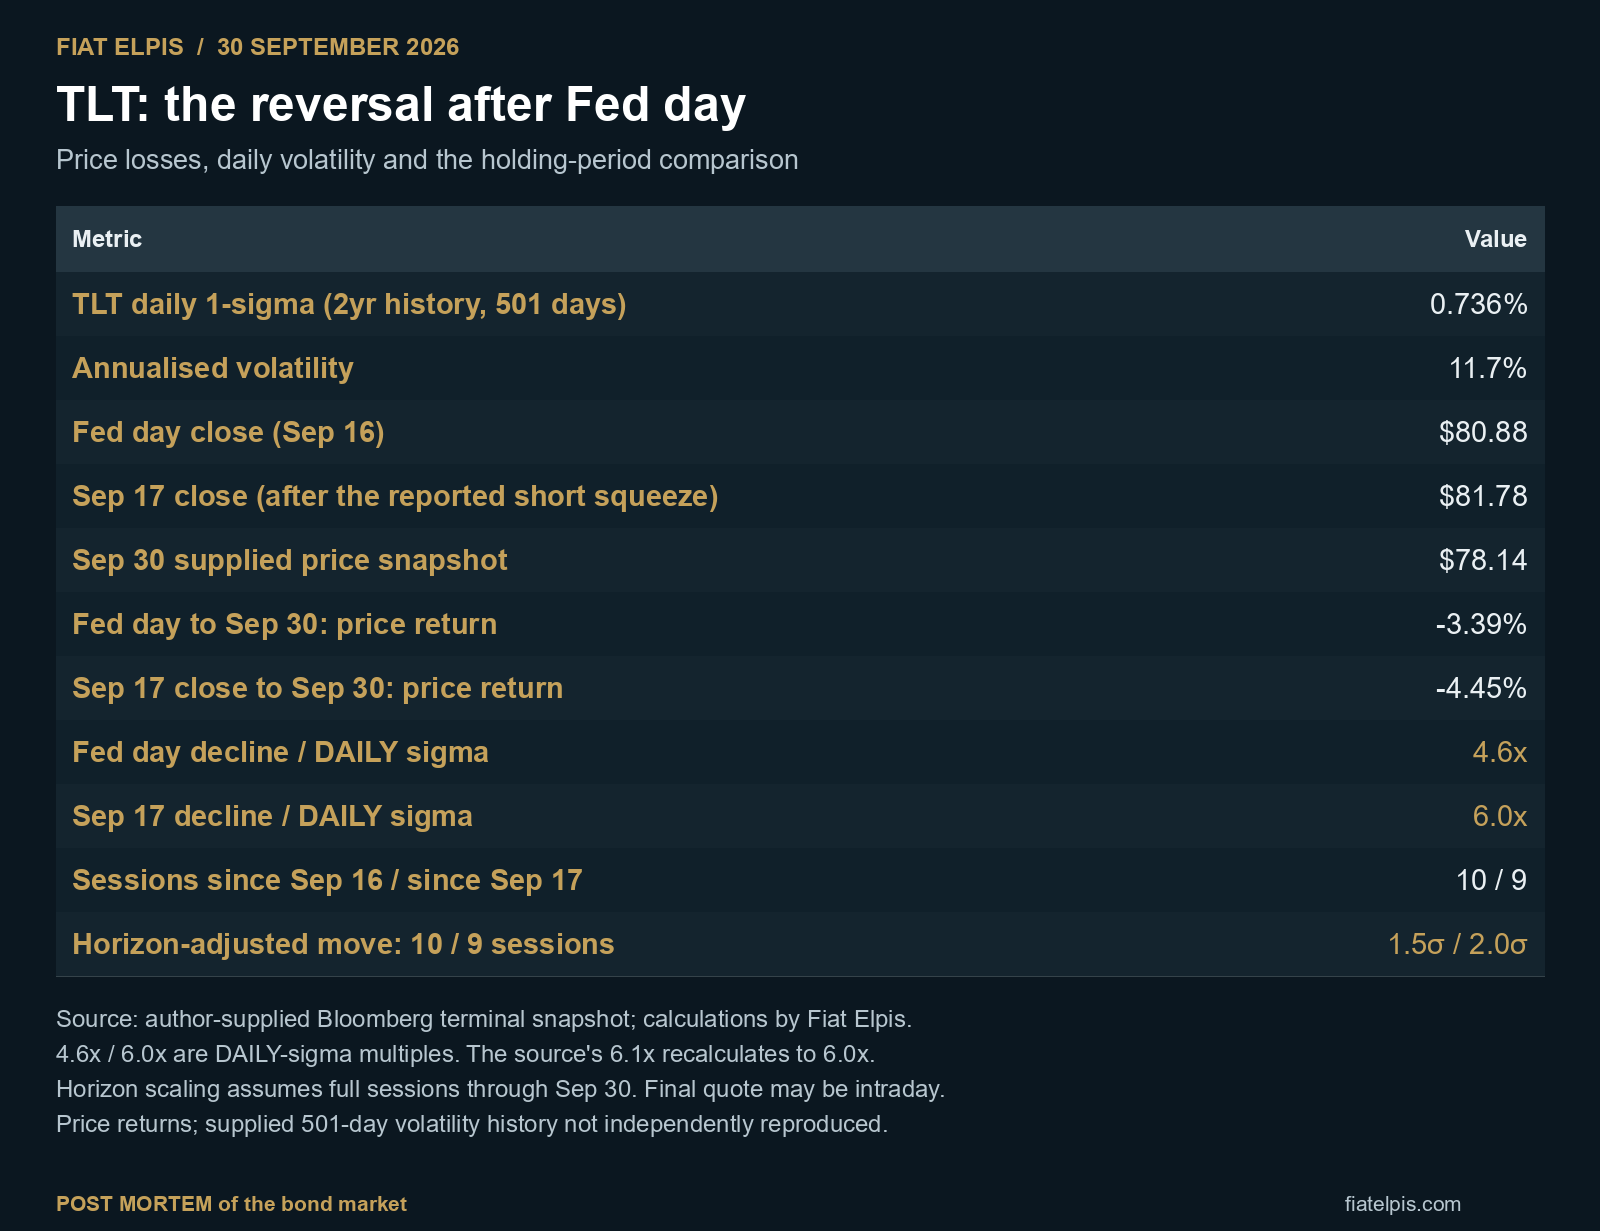
The volatility arithmetic needs the right horizon. Dividing these cumulative losses by the supplied 0.736% daily standard deviation gives approximately 4.6 and 6.0 daily-volatility units. The source labels the second figure 6.1; the displayed inputs give 6.05 before rounding. Neither is a holding-period sigma score.
Under a simple independent-return, constant-volatility approximation, volatility scales with the square root of time. From September 16 to September 30 there are ten trading sessions: 0.736% × √10 = 2.33%, putting the 3.39% move at roughly 1.5σ. From September 17 there are nine: 0.736% × √9 = 2.21%, putting the 4.45% move at roughly 2.0σ. Using a common ten-session window for the latter would give about 1.9σ, not 2.6σ.
That remains a substantial loss for a leveraged duration position. It does not support a six-sigma event claim or a one-in-10,000 probability. The comparison assumes full sessions through September 30, a negligible mean and stable volatility; it is approximate if the last observation is intraday. These are price changes, not a dividend-adjusted total-return calculation, and a historical volatility estimate is not a guarantee about future tails.
“Higher yields can attract buyers. Forced sellers need buyers now.”
Saâd Filali Khattabi · Fiat Elpis
02 · Auction demand
Supply is finding buyers at a higher price of money
| Auction | Date | High yield | Prior yield | B/C | Prior B/C | Indirect % | Prior indirect % |
|---|---|---|---|---|---|---|---|
| 10Y TIPS reopening | Sep 17 | 2.653% | 2.438% | 2.24 | 2.30 | 59.1% | 65.2% |
| 2Y notes | Sep 22 | 4.787% | 4.204% | 2.63 | 2.60 | 57.8% | 66.0% |
| 5Y notes | Sep 23 | 5.033% | 4.393% | 2.21 | 2.37 | 54.3% | 61.5% |
| 7Y notes | Sep 24 | 5.085% | 4.512% | 2.42 | 2.50 | 57.2% | 60.8% |
Participation weakened across several measures
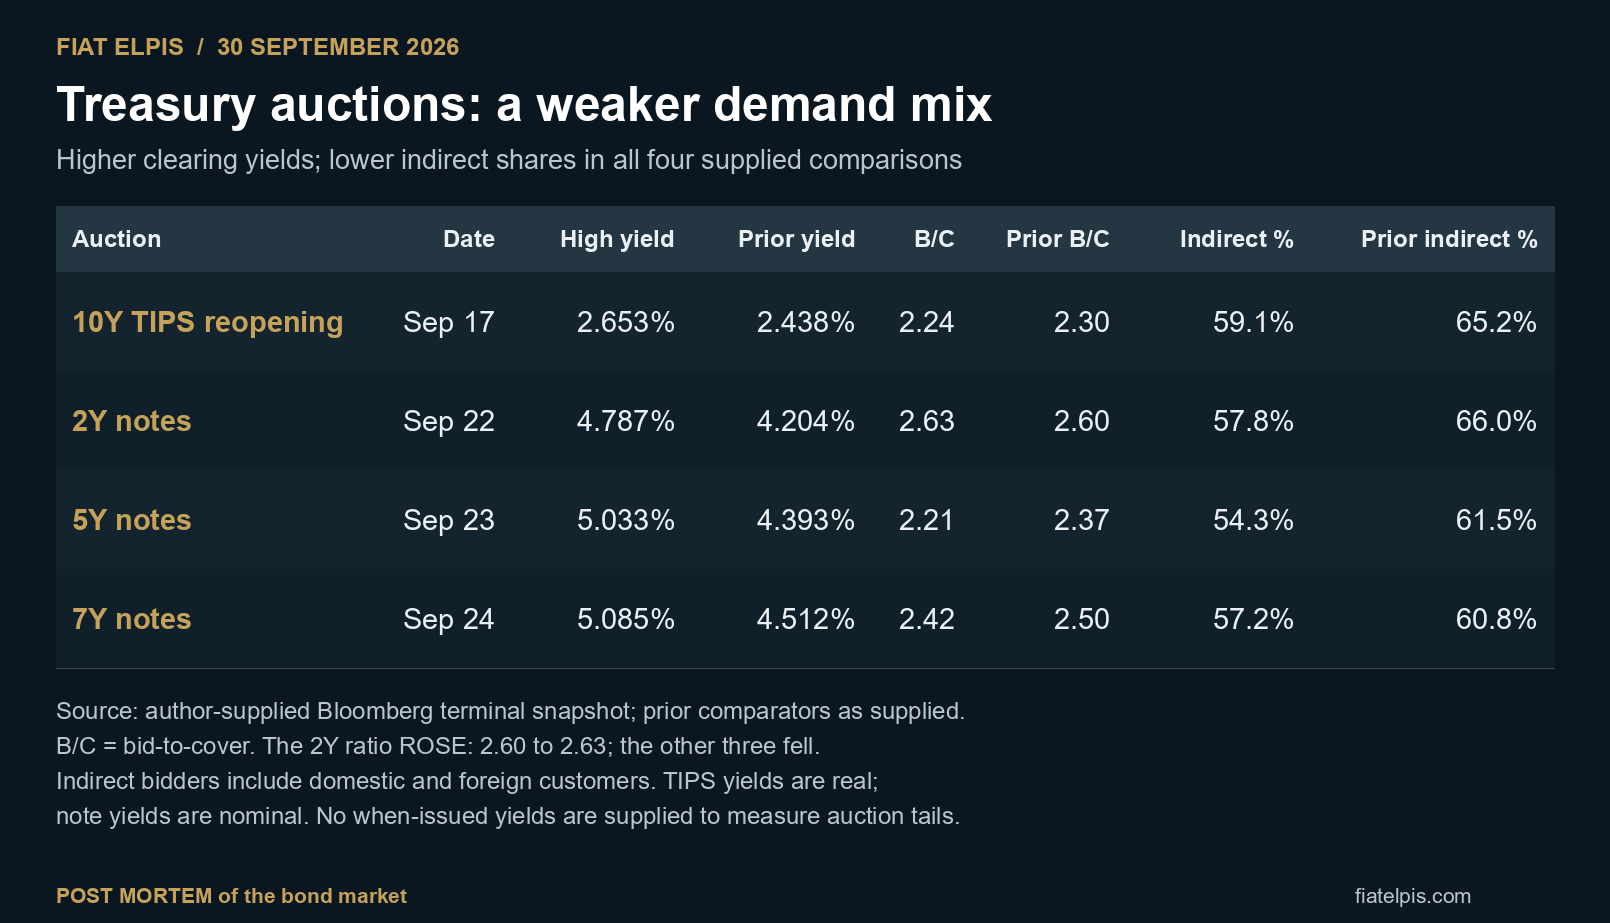
The four auctions in the supplied snapshot all show higher clearing yields than their prior comparators and lower indirect-bidder shares. Bid-to-cover fell in three of the four. The 2-year is the exception: its ratio rose from 2.60 to 2.63. The pattern is broad weakness, with a clear exception rather than uniform deterioration.
The weakest combination in this sample
The 5-year cleared at 5.033%, versus 4.393% previously. Bid-to-cover fell from 2.37 to 2.21, and the indirect share fell 7.2 percentage points, from 61.5% to 54.3%. That combination supports concern about participation at the auction; the higher yield alone would not establish weak demand.
Indirect participation is broader than foreign buying
Treasury defines indirect bidders as customers bidding through intermediaries. The category includes domestic and foreign investors. A falling indirect share therefore does not establish that foreign central banks are retreating. Investor-class allotments are the more appropriate place to test a foreign-demand claim.2
Watch the concession, then the follow-through
A higher auction yield can reflect a market that repriced before bidding began. The sharper demand test is the result relative to the when-issued yield immediately beforehand, together with dealer takedown and trading after the auction. The supplied table has no when-issued yields, so it cannot establish auction tails.
The pressure point
A market can clear every auction and still become harder to own. Higher yields improve prospective returns. Existing holders absorb the price adjustment first, and leverage determines how much time they have to wait.03 · Leverage and funding
The danger is the financing of the position
An outright long-duration position loses when yields rise. A Treasury basis trade has a different construction: typically a repo-financed cash bond paired with a short Treasury future. As bond and futures prices fall together, the short future generally gains while the cash bond loses. A selloff does not mechanically generate a variation-margin loss on that short-futures leg.3
The pressure can come from a worsening cash-futures spread, more expensive or less available repo, larger collateral haircuts, higher initial-margin requirements, or a timing mismatch between cash needs and offsetting gains. Small relative-value losses become consequential when the gross position is large. Federal Reserve research identifies financing and margin vulnerabilities as potential channels for distressed unwinds.4
Multi-manager funds add another possible transmission channel. Teams operating under drawdown and risk limits may reduce exposure at similar moments. That is a plausible amplification mechanism; TLT's price alone cannot establish which teams were stopped out, whether virtually every rates pod reduced risk, or whether the selling has been orderly.
The supplied material does not establish a specific fund failure. The useful distinction is between losses on an exposed trade, liquidity pressure on a leveraged book and distress at an entire institution. A successful directional short says little about a hedged basis book. Fundraising demand says little about the day-to-day financing of either. Those exposures should not be treated as interchangeable.
- Duration: a further rise in yields imposes additional mark-to-market losses on outright longs.
- Supply: auctions that require larger concessions can keep resetting the level at which buyers will commit.
- Funding: adverse basis moves or tighter repo and margin terms can force a leveraged holder to reduce a position before its expected convergence.
- Feedback: selling cash bonds into thinner liquidity can worsen execution and put pressure on other holders with similar risk constraints. This is the scenario to monitor, not an observed chain of events proved by this table.
04 · Signs of stabilisation
What would tell me the adjustment is stabilising
The next 10-year and 30-year nominal coupon auctions are useful checkpoints. I would look for several signals together:
- Auctions stop through or clear close to their when-issued yields, with solid end-investor participation and manageable dealer inventories.
- Repo financing remains available on stable terms, while cash-futures spreads and margin requirements settle down.
- Long-duration prices hold their gains after auctions and data releases, rather than producing another short-lived bounce.
- Treasury liquidity and credit spreads stabilise together, suggesting the adjustment is being absorbed without a broader scramble for cash.
The post mortem
The post mortem is about the cost of being early
The supplied prices show what happened to investors who bought the post-Fed recovery: a 4.45% reversal from the September 17 close. The auction table shows a less comfortable demand picture, especially in the 5-year. Together they argue for close attention to how the next round of supply is financed and absorbed.
My concern is that a duration loss can become forced selling when leverage removes the option to wait. The evidence here supports that risk as a watchpoint. It does not establish a six-sigma shock, a foreign buyers' strike or a hidden multi-strategy blowup. The next phase will be decided by the quality of demand at these yields and the resilience of the funding behind it.
Sources & method
Sources and calculation notes
- 1. Bloomberg terminal market note supplied by the author, September 30, 2026 — TLT price/volatility snapshot and auction comparisons. Linked September 23 bond-market report is contextual; the table inputs are from the supplied note.
- 2. US Treasury — Auction FAQs: indirect bidders include domestic and foreign customers; foreign participation is reported separately in investor-class allotments.
- 3. Federal Reserve — Quantifying Treasury Cash-Futures Basis Trades, March 8, 2024: construction and risks of the cash-futures trade.
- 4. Federal Reserve — Hedge Fund Treasury Exposures, Repo, and Margining, September 8, 2023: leverage, haircuts and potential distressed unwinds.
- 5. US Treasury — Announcements, Data & Results: official auction results and schedules.
Market and auction figures reproduce the author's supplied September 30 terminal snapshot; the underlying 501 daily observations and original auction releases were not independently reproduced. Calculations use simple percentage price changes and the supplied 0.736% daily standard deviation, with 252 sessions for annualisation. The source's 4.6σ/6.1σ labels refer to multiples of daily volatility; the displayed inputs yield about 4.6x/6.0x; the horizon-adjusted comparisons are about 1.5σ over ten sessions and 2.0σ over nine. September 30 has no supplied quote timestamp. TIPS yields are real yields; note yields are nominal. ‘Prior’ means the comparator in the supplied snapshot. The Bloomberg terminal link may require a subscription. Structural mechanisms are sourced separately from claims about current fund activity.